 ZARI Blog
West Africa’s sugar market: production, consumption and imports in figures
In this article
- 1. Read the figures on a consistent basis
- 2. Local production and consumption: four contrasting markets
- 3. White sugar imports: quantities and values
- 4. Brazilian sugar suppliers and demand growth
- 5. White sugar price per tonne: compare delivered costs
- 6. Import rules and purchasing specifications
- 7. What should buyers and investors monitor?
- Methodology and limits
- Sources and verification
West Africa is an important sugar import market, but countries have very different supply structures. Côte d’Ivoire produces most of its estimated requirements, Senegal and Mali cover a substantial share, and Nigeria combines extensive refining with dependence on imported raw sugar. For wholesale white sugar buyers, population and import volumes alone do not identify an accessible market.
This analysis connects production and demand figures with recorded trade, supplier origins and purchasing conditions. For a commercial enquiry, see ZARI’s white sugar import and export page and specify the product, quantity, destination and shipment window.
1. Read the figures on a consistent basis
The import comparison uses calendar year 2024. Production and demand references retain their own years or marketing seasons. They cannot be added together as a 2026 regional total. Sugar made from locally grown cane is different from refined sugar made from imported raw material; packing imported white sugar is a third activity. Installed capacity is not actual output.
Gross imports can replenish stocks or be re-exported. Local availability equals production plus imports, less exports, adjusted for stock changes. Food uses, non-food uses and losses must then be distinguished. Tonnes of cane, sugar and raw sugar equivalent are not interchangeable. [16]
2. Local production and consumption: four contrasting markets
| Country and reference period | Local sugar production (t) | Consumption or requirements (t) | Local coverage |
|---|---|---|---|
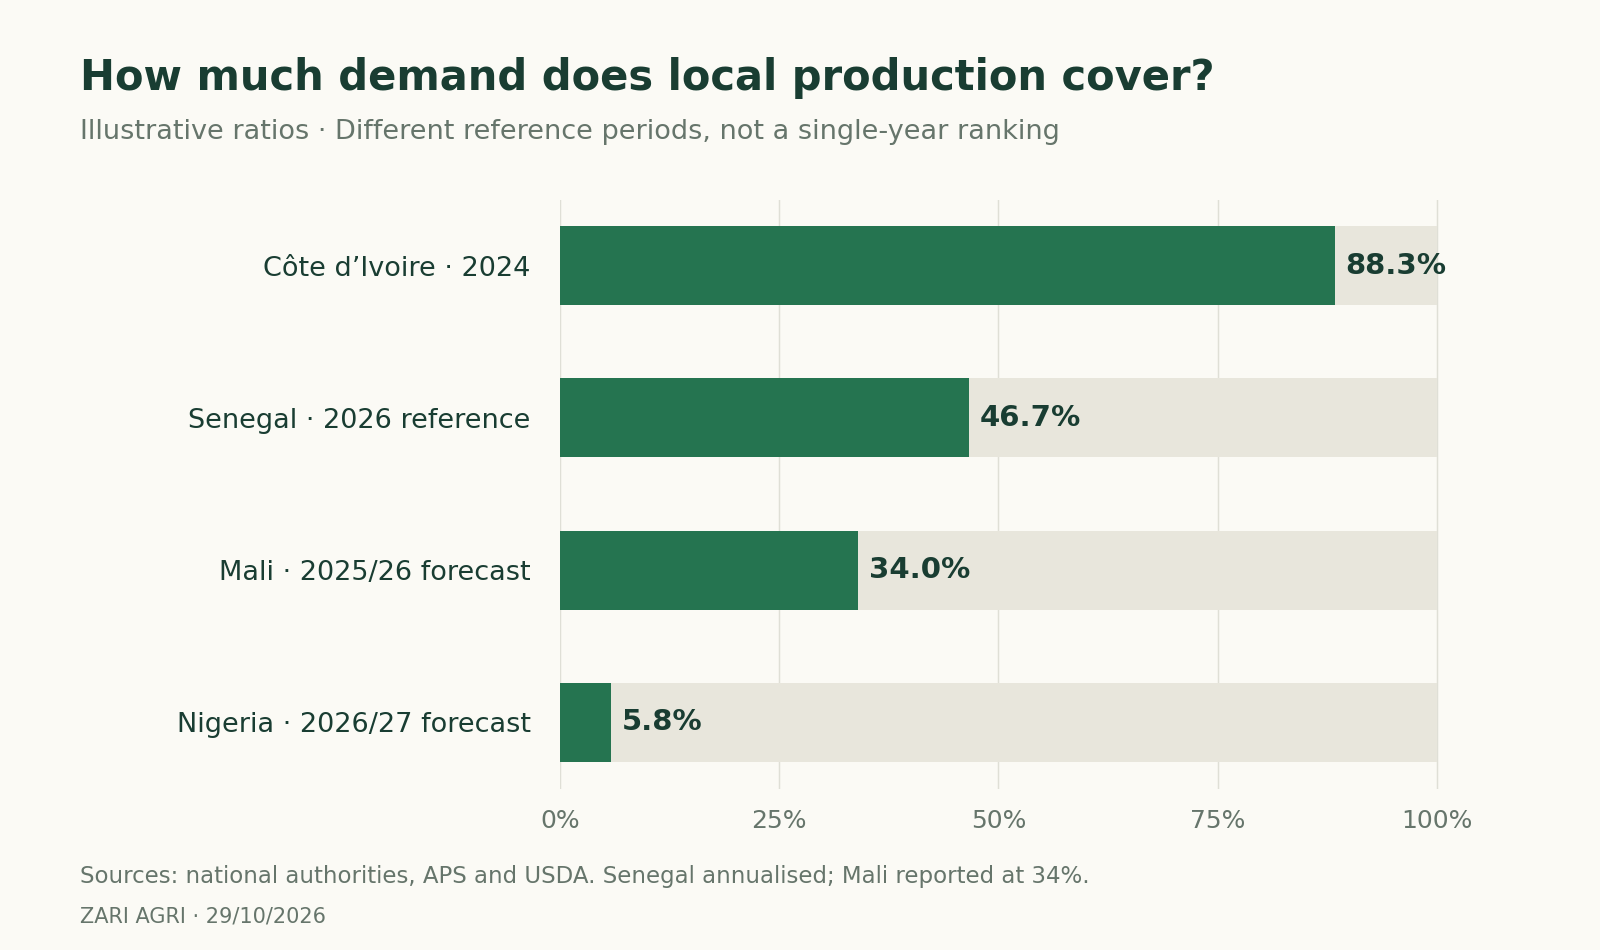
| Nigeria · 2026/27 forecast | 105,000 | 1,800,000 human consumption | 5.8% |
| Côte d’Ivoire · 2024 | 212,034 | 240,000 estimated requirements | 88.3% |
| Senegal · July 2026 reference | ≈140,000 | 300,000 annualised from 25,000/month | ≈46.7% |
| Mali · 2025/26 forecast | ≈120,000 | ≈353,000 derived from 34% coverage | ≈34% |
The coverage ratios are calculated from the stated production and demand figures. Senegal’s annual demand is an extrapolation, not an independently observed annual series. Mali’s approximate requirement is 120,000 ÷ 0.34. These different periods are not a harmonised annual ranking. [1][2][3][4]
Nigeria: refining capacity does not mean agricultural self-sufficiency
USDA forecasts 105,000 tonnes of production and 1.8 million tonnes of human consumption for 2026/27. Its balance sheet projects 2 million tonnes of raw imports, plus 130,000 tonnes of refined imports expressed in raw equivalent: 2.13 million tonnes in total. Forecast exports of 350,000 tonnes help explain why imports differ from domestic consumption. For calendar 2025, the report gives 1.7 million tonnes of raw imports, with Brazil supplying over 97%. These periods and measures should not be mixed. [1]
Côte d’Ivoire, Senegal and Mali
Côte d’Ivoire’s official series records 212,034 tonnes in 2024 against requirements of 240,000 tonnes: a calculated gap of 27,966 tonnes. Output rose about 6.7% from roughly 198,650 tonnes in 2015. The official portal describes four agro-industrial units operated by two companies. A production gap is not automatically the quantity actually imported. [2]
The Senegal reference implies a theoretical gap of about 160,000 tonnes per year. Mali’s forecast output of approximately 120,000 tonnes from SUKALA and N-SUKALA covers about 34% of needs, implying an uncovered requirement near 233,000 tonnes. These are arithmetic comparisons, not confirmed import orders. [3][4]
Other countries also have local production
Burkina Faso’s ministry reported about 30,000 tonnes and 4,000 hectares for SN-SOSUCO in March 2023. Togo’s official portal reported 7,000–8,000 tonnes annually at SINTO in September 2022. Both are historical references, not 2026 results. Ghana’s ministry reported in March 2025 that Komenda was idle because of raw material shortages; that statement does not establish its operating status in October 2026. Factory capacity must never be counted as demonstrated production. [6][7][8]
3. White sugar imports: quantities and values
HS 170199 covers forms of solid non-raw sugar, including white sugar. It excludes raw sugar for refineries and is not a total for every sugar product. The table reports importing-country data, partner World, converted from kilograms to tonnes and from thousands to millions of US dollars. [5][17]
| Market | Quantity (metric tonnes) | Value (USD million) |
|---|---|---|
| Ghana | Not available | 170.93 |
| Senegal | 264,287 | 96.98 |
| Burkina Faso | 307,271 | 76.58 |
| Mali | 161,747 | 55.80 |
| Benin | 118,374 | 48.40 |
| Togo | 225,026 | 40.71 |
| Côte d’Ivoire | 45,000 | 30.58 |
| Niger | 48,328.2 | 23.50 |
| The Gambia | 113,444 | 18.55 |
| Liberia | 23,518.2 | 16.62 |
| Cabo Verde | 15,118.1 | 11.62 |
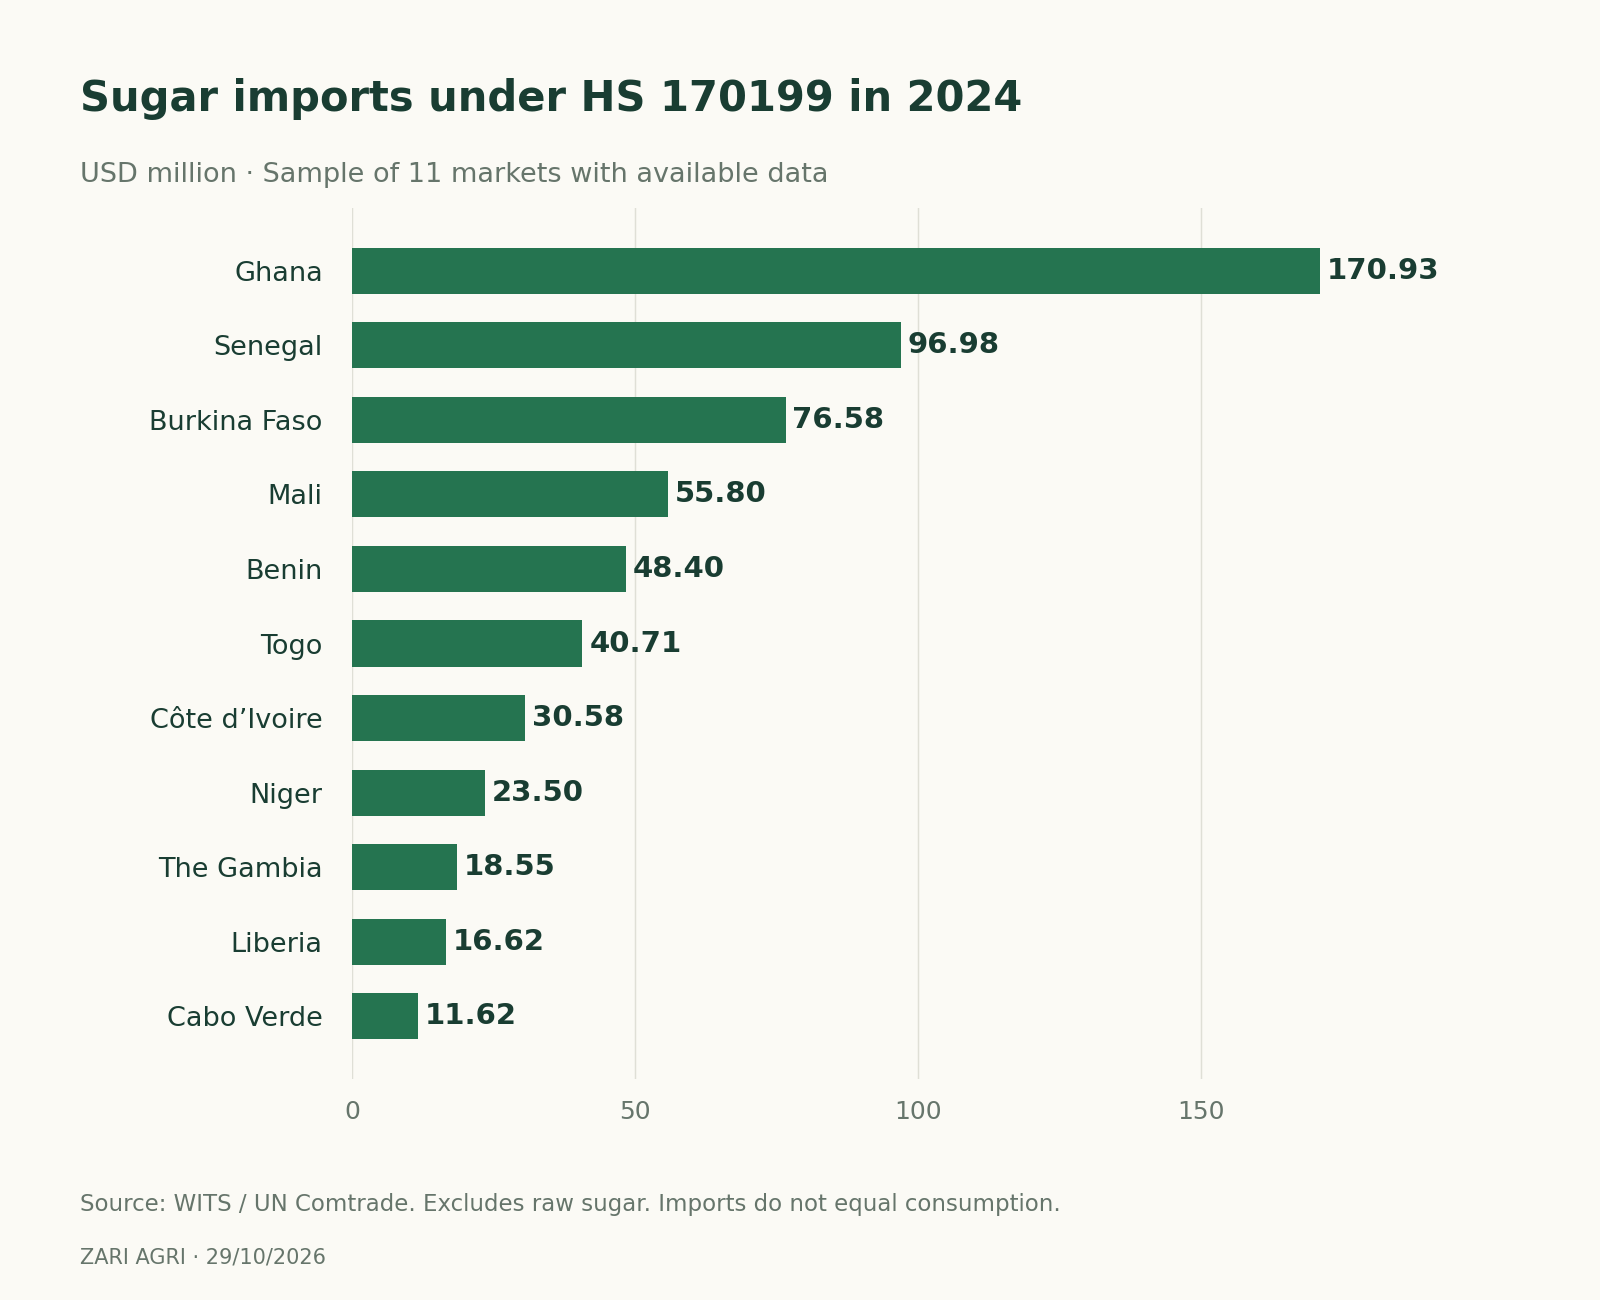
Ghana’s aggregate quantity was unavailable in the retrieved comparison and has not been estimated from an assumed price. Nigeria is treated separately because raw sugar dominates its imports. Guinea, Guinea-Bissau and Sierra Leone lacked entries in this retrieved comparison; missing data are not zero trade. National imports should not be summed as external regional imports without removing intra-regional trade and re-exports.
4. Brazilian sugar suppliers and demand growth
For HS 170199 in 2024, Brazil supplied 207,282 tonnes to Senegal, 201,149 to Togo and 257,892 to Burkina Faso: respectively 78.4%, 89.4% and 83.9% of recorded import quantities. These are shares for one product code and year, not all sugar. France also appears among suppliers. Concentrated sourcing can transmit changes in harvests, freight and delivery schedules across several markets. [13][14][15]
Demand includes household purchases and food manufacturing. OECD–FAO projects Africa to account for around 29% of global sugar demand growth over 2025–2034. This is a forecast for the whole continent, not West Africa alone. Population growth does not guarantee sales for a particular importer; affordability, industrial specifications and distribution still matter. [10]
5. White sugar price per tonne: compare delivered costs
The FAO Sugar Price Index reached 114.0 points in September 2026, up 6.1% month on month and 14.7% year on year in the 2 October release. An index is not a dollar-per-tonne quotation or a delivered offer for Lomé, Dakar or Abidjan. [11]
When comparing bulk ICUMSA 45 sugar and Brazilian white sugar offers, request the metric tonnage, packaging, validity, named port and agreed delivery terms. Specify FOB at the loading port, CFR or CIF at the destination as applicable, and compare what each quotation includes. Freight, insurance, handling, customs, inland transport, storage and finance determine the delivered cost. Do not count an included charge twice or treat annual customs unit values as spot prices.
6. Import rules and purchasing specifications
USDA describes Nigerian raw sugar imports as linked to the backward integration programme, alongside restrictions on refined imports. Côte d’Ivoire’s portal describes protection for domestic output and exceptional import openings. On 19 October 2026, Senegal’s RTS reported an announced import suspension from November for an expected eight to nine months, subject to production and requirements. At this article’s review date it was a prospective measure: confirm implementation and amendments before shipping. [1][2][12]
A request to buy white sugar wholesale through ZARI should identify origin, colour specification and test method, purity, moisture, grain size and packaging, including 50 kg bags if required. ICUMSA 45 should be supported by the agreed specification and analysis documents; it is not a substitute for identifying the product and applicable customs code. Define inspection, sampling, acceptance criteria, net weight and delivery timing. Codex CXS 212-1999 is a general reference, not a replacement for destination-country or buyer requirements. [18]
HS 1701 is the broader sugar heading. Modern classifications distinguish other raw cane sugar under 170114 from non-raw sugar under 170199. Some WITS series use older code 170111; reconcile classifications before combining data. [17]
7. What should buyers and investors monitor?
Local cane production can reduce import requirements only if fields, irrigation, harvesting, transport and extraction operate together. Refining and packing can grow while dependence on imported feedstock persists. Reliable industrial supply requires repeatable quality and delivery, actual buyers, finance and market access; announced investment or nominal factory capacity alone is insufficient. The public ISO regional summary supports this structural reading, but its broader geographic coverage is not used here as a West Africa total. [9][10]
Methodology and limits
Reviewed on 29 October 2026. Nigeria’s report prose describes local production as below 5%, whereas its table gives 105,000 ÷ 1,800,000 = 5.8%; this article uses the table calculation and discloses the difference. Historical output references, forecasts and annualised estimates retain their labels. No synthetic regional consumption total is presented. The cover is illustrative; the charts use the displayed source figures.
Sources and verification
- USDA FAS — Nigeria Sugar Annual, NI2026-0007 (19/03/2026)
- Côte d’Ivoire — Portail économique, agroalimentaire (2024)
- Mali — Conseil des ministres (13/02/2026)
- APS — Sénégal (13/07/2026)
- World Bank WITS / UN Comtrade — HS 170199 (2024)
- Burkina Faso — Ministère de l’Industrie et du Commerce (20/03/2023)
- République togolaise — SINTO (14/09/2022)
- Ghana — Ministry of Trade and Industry, Komenda (03/03/2025)
- International Sugar Organization — MECAS(25)17
- OECD–FAO — Agricultural Outlook 2025–2034
- FAO — Sugar Price Index (09/2026; 02/10/2026)
- RTS — Sénégal (19/10/2026)
- WITS / UN Comtrade — Senegal, HS 170199 (2024)
- WITS / UN Comtrade — Togo, HS 170199 (2024)
- WITS / UN Comtrade — Burkina Faso, HS 170199 (2024)
- FAO — Food Balance Sheets: A Handbook
- Japan Customs — Harmonized System, Chapter 17
- Codex Alimentarius — CXS 212-1999